In business environment, we are used to see Excel pivot tables, dashboard applications and data-and-chart loaded PowerPoint presentations for mission-critical reporting. Today, R language and extended tools have the potential of combining all of these functionalities, especially for statistical data analysis and data-driven graphical presentations into one dynamic workflow.
R is an open-source programming language for statistical computing. It has gained much popularity among data analysts and data scientists today. R objects and libraries support a wide range of statistical tools and graphical techniques. Its object-oriented programming model allows easy extension of R among other software programming languages. For example, it can combine C/C++, Fortran to handle heavy computational tasks and at the same time be called within JAVA, .NET or Python for business applications. It also supports a LaTeX-like documentation format.
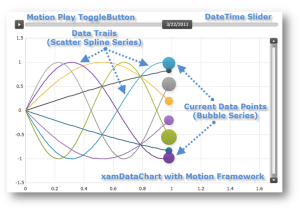
The extended family tools of R are booming in open source world. RStudio, an open source startup, offers R Shiny Server, a web application framework based on R to produce interactive web applications and visualizations. R Shiny Server supports many data-binding widgets that can be easily dragged into web UI. Along with more sophisticated graphic tools such as Google Charts (with googleVis package, an interface of R and Google Charts APIs), many interactive pivots or dashboards can be built on the fly and displayed dynamically. With the ability to combine coding on the same page of the presentation, it offers greater capabilities in allowing dynamic contents online. One of the typical example is a Motion Chart (see pic), used for finance, traffic, voting, and many other areas that requires instant statistical handling of large amount of dynamic data and fast visual displays. These charts automatically bind data point-by-point on UI by design.

For enterprise users, the power of full automation on many data-driven business reporting is within reach. To use R-series tools, a backend data pipeline still needs to be built but not complicated. Today data analysts in many companies are exploring these tools to gain instant business values and visibility out of the typically tedious and often offline data analysis work. For example, eBay has been using R Shiny Server for reporting eBay Partner Network analytics.
Would R and its family tools be a disruptive solution to Excel pivots and PowerPoint for data presentations? Maybe. Only time will tell.
